Animals
 Animation
 Art of Playing Cards
 Drugs
Drugs Education
 Environment
 Flying
 History
 Humour
 Immigration
 Info/Tech
 Intellectual/Entertaining
 Lifestyles
 Men
Men Money/Politics/Law
 New Jersey
 Odds and Oddities
 Older & Under
 Photography
 Prisons
 Relationships
 Science
 Social/Cultural
 Terrorism
 Wellington
 Working
 Zero Return Investment
Not Perfect but Fairly Plentiful
Indicators of Water Quality StatusThe activist is not the man who says the river is dirty. The activist is the man who cleans it up. - H Ross Perot
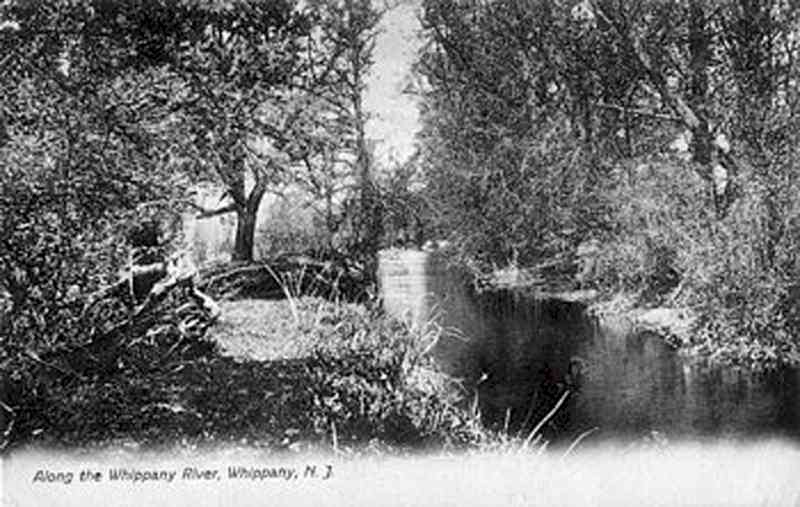
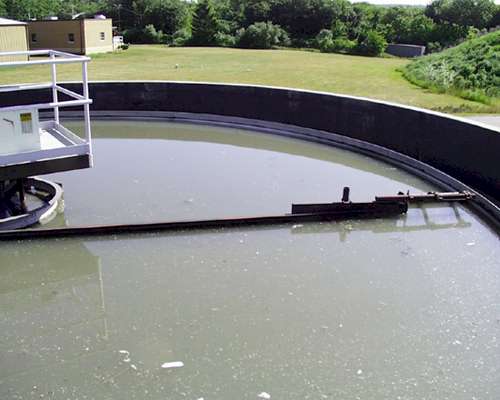
The Whippany over 100 years ago Our Biology of Environmental Concerns class went on a field trip to the Roxbury Water Pollution Control Facility this past summer. While there, we ran simple tests on the quality of the upstream water, the effluent, and the downstream water. It is unknown how large the regulatory mixing zone is for the Roxbury Water Pollution Control Facility, therefore we could draw no firm conclusions as to whether or not the physical and chemical tests upstream and downstream would be able to be considered equivalent under state water quality standards, but that they were seemed unlikely, particularly for chemical conditions including phosphates, nitrates and ammonia. “Natural water quality" means the water quality that would exist in a waterway without the addition of water or waterborne substances from artificial origin. Presumably that means human origin (artificial creatures that we are). The applicant for modification of effluent limitations for parameters that currently do not meet the state's water quality criteria must demonstrate, to the satisfaction of the Department, after public notice (including notice to affected municipalities) and a public hearing (where sufficient public interest exists), that water quality criteria are not attainable. Was this done at Roxbury? (Doubt it.) Looking at the data obtained from prior classes. the water upstream cyclically falls below state standards and it is infrequent that the wastewater treatment plant, except in the area of dissolved oxygen, discharges water of a quality better than that found in the river upstream. Generally, discharges fall below upstream quality. Should something be done? If financial resources were unlimited, then certainly. But the benthic diversity of this stream is likely higher than that of at least some comparable streams in the same area. Resources are generally allocated where they are needed most. If the quality if this stream continues to fall, then the treatment plant may be forced by regulatory bodies to install more comprehensive tertiary cleansing procedures. Until this happens, the status quo will almost certainly prevail – a gentle drift downward in quality (mostly due to population pressures) until a new plant needs to be built or until someone files a lawsuit. Having spent two years living in a motor home and five years living on a boat, I am not a stranger to wastewater and the problems surrounding it. It smells; it clogs; it can be toxic – and the longer it takes to dispose of it, the worse the problems surrounding it can get. I didn’t look forward to the trip to Roxbury because I don’t enjoy smelling waste – but we were assured that the smell would be confined to the beginning of the tour and wouldn’t be all that bad. (And except for a couple of minutes of nausea while on the catwalk, I found those statements generally to be true.)
Was the trip interesting? I would say more reassuring than interesting. It was reassuring to think that water that smelly, that dirty could end up smelling and looking like a backyard swimming pool. (So what if chlorine produces trihalomethanes – it has a reassuring clean smell associated with school, picnics, learning to dive at the YMCA, et cetera.) The fact that plants seemed to love it, that it was dechlorinated before being discharged, and that water tests didn’t indicate serious problems with the effluent were also reassuring. Women have as many as 20 million more axonic nerve fibres – they are equipped to receive a wider range of sensory information with greater facility. I suspect that may be one of the reasons why there are far more men in the wastewater treatment business than there are women. In fact, I found an advertisement online for a wastewater treatment plant operator which contained the following “Special Notes”:
So, do I want to go into the wastewater treatment business as a result of this tour? No. But that doesn’t mean I’m not glad I went. As a matter of fact, I think a tour should be mandatory for each person requesting a sewer connection. People need to understand a lot more about waste than they do. (I think tours of landfills and/or incinerators should also be mandatory.) After the tour, people could then be made aware of the alternatives – recycling, wastewater gardens, conservation and all the rest. Perhaps this would increase interest in this important topic.
Since there is no single, universal parameter that adequately describes surface water quality, investigators typically use several indicators related to sanitary quality, ability to sustain aquatic life, ecosystem productivity and æsthetics. These indicators include
Dissolved oxygen supports life functions of most aquatic organisms. Usually low levels of dissolved oxygen can be found just before sunrise. There is plenty of dissolved oxygen during the day, when algae are busy using sunlight in photosynthesis, but at night plants take back oxygen. DO is considered a key indicator of overall water quality. During the summer months, it decreases naturally as water temperature rises and biological activity increases (more fish and they breathe faster in warm weather). Decaying plants use up oxygen, too. Something called the five-day biochemical oxygen demand (BOD5) measures the amount of DO (per unit volume) required to stabilise a water sample over a 5-day incubation period at 20ºC. High BOD and low DO levels are bad signs. The pH of a water sample is a measure of its acidity. Derived from French pouvoir hydrogène or "hydrogen power", pH is defined as the negative logarithm of the hydrogen ion concentration (that is, pH = -log10[H+], where [H+] is the concentration of hydrogen ions in moles per litre). The pH of pure (neutral) water is 7. Acidic solutions have a pH ranging from below 7 to 0; basic solutions range from above 7 to 14. Alkalinity is a measure of the acid-neutralising (that is, buffering) capacity of a water sample. High alkaline waters essentially absorb excess H+ ions and prevent occurrence of significant pH fluctuations in a water body. In many natural water bodies, the buffering system is essentially carbonate-bicarbonate. While alkalinity can beneficially prevent pH fluctuations (for example, due to acid rain), excessive alkalinity and low pH may adversely impact fish development and growth. Sewage effluent often increases the natural alkalinity of a water body. Total and fæcal coliforms measure sanitary quality in terms of bacterial counts within a given sample volume. High fæcal coliform levels indicate the presence of feces in a waterway and, perhaps, the presence of other more dangerous pathogens. Exposure to such pathogens (by contact or ingestion) may cause illness (for example, gastroenteritis or hepatitis). Sources include illegal sewage connections, sewage treatment plant bypasses, stormwater outfalls, nonpoint sources (such as storm runoff), leaking septic tanks, wildlife waste (and tour buses that dump their tanks off a bridge). Chlorophyll is a green pigment in plants, some algae and some bacteria that absorbs the light necessary for photosynthesis. Chlorophyll’s chelated structure consists of a magnesium ion bonded to a large organic porphyrin molecule in a square flat arrangement. There are several forms of chlorophyll - each slightly different - but the most common type is chlorophyll-a, making up abut 75% of the chlorophyll in green plants. In natural waterways, measurements of peak chlorophyll-a concentrations are often used as a surrogate measure of how much phytoplankton there is and how much excess algae (called eutrophication). Major nutrients in the subject waterways include various species of nitrogen and phosphorus. Reduced forms of nitrogen include total ammonia, un-ionised ammonia (NH3) and organic nitrogen. Ammonia, an inorganic form of nitrogen, is an oxygen consumer and an indicator of water health. Organic nitrogen hydrolyses to ammonia. Un-ionised ammonia is toxic to various aquatic species and is regulated. The sum of ammonia plus organic nitrogen is another indicator, Total Kjeldahl Nitrogen (TKN). Major sources of TKN include wastewater discharges and rotting plants. Oxidised nitrogen species include nitrate (NO3) and nitrite (NO2). Nitrate and ammonia are common forms of dissolved inorganic nitrogen (DIN). Nitrite oxidises rapidly to nitrate. Also, ammonia is oxidised to nitrate. Sources of ammonia include sewage treatment plants, animal waste and decaying organic matter. In most freshwater lakes and nontidal streams, phosphorus is a key nutrient regulating algal growth. Predominant phosphorus species include total phosphorus (TP) and orthophosphate (PO4). Total Phosphorus has three components: dissolved inorganic phosphorus, particulate inorganic phosphorus and organic phosphorus. Orthophosphate is water soluble and readily available for uptake by algae and plants. Sources include runoff, soil weathering, sewage discharge and atmospheric deposition. An important indicator of water quality is the amount of solids in the water column - both dissolved (filterable) solids and undissolved (suspended) solids. Suspended Solids are small particles (such as fine silts and clays, mineral particles, microbes, and detritus) that absorb sunlight and colour or cloud water. Suspended sediments include wastewater treatment plants, stormwater outfalls, bank erosion, bed resuspension and atmospheric deposition. High Total Suspended Solids (TSS) concentrations may adversely impact water quality in several ways, including:
A commonly used measurement of suspended material is the Total Suspended Solids (TSS) analytical method. This method was originally developed for use on wastewater samples, but has been widely used as a measure of suspended material in stream samples because it is inexpensive to determine. A commonly used measurement of dissolved material is Total Dissolved Solids (TDS). TDS is the term used to describe the inorganic salts and small amounts of organic matter present in a water sample. The principal constituents are usually cations of calcium, magnesium, sodium, and potassium, and anions of carbonate, hydrogencarbonate, chloride, sulfate, and nitrate anions. Sudden exposure to relatively high TDS concentrations may adversely impact aquatic organisms. Also, high TDS levels may impair water taste and drinkability. The common method of determining TDS is to measure conductivity with a probe that detects the presence of ions in water. Sources of TDS include natural sources, sewage, urban and agricultural run-off, industrial wastewater and road-de-icing. Total Organic Carbon (TOC) is an important water quality indicator since organic matter (both dissolved and particulate organic carbon) plays a major role in the ecology of aquatic systems. Carbon affects biogeochemical processes, nutrient cycling, bioavailability, chemical transport and interactions. TOC is a measurement of the carbon dioxide released by chemical oxidation of the organic carbon in a sample. Chlorides are salts resulting from the combination of the gas chlorine with a metal (like sodium or magnesium). Chlorine alone as Cl2 is highly toxic (a common disinfectant). Small amounts of chlorides are required for normal functions in plant and animal life. Chlorides have no biochemical sources or sinks in a waterway. Chloride sources are both natural (geological) and anthropogenic (often runoff from road salts). Sulfate (SO4) is a divalent anion that occurs naturally in waterways as a result of the weathering of rocks. Also, anthropogenic sulfate sources include mine drainage, industrial discharges and atmospheric deposition. Although sulfate is a natural and necessary constituent for humans, sulfate salts may cause adverse health effects (such as diarrhœa). Also, sulfate has been linked to animal toxicity. The sodium ion is the 6th most abundant metallic ion in the earth's crust, and a natural constituent of both food and water. Also, seawater is an abundant natural source. Anthropogenic sources include road-de-icing salts. Sodium is known to cause health impacts in cardiac patients and is regulated in drinking water supplies. Physical properties of natural waters often affect water quality. These properties include turbidity and water temperature. Turbidity is a condition of reduced water clarity resulting from the presence of suspended solids in the water column, including silts, clays, industrial wastes, sewage, plankton and other suspended organic matter. Turbidity - an optical measurement that compares the intensity of light scattered by a water sample with the intensity of light scattered by a standard reference suspension - is commonly recorded in Nephelometric Turbidity Units (NTU). Secchi depth is a measure of the limit of vertical visibility in the upper water column. The latter is a direct function of water clarity. High Secchi depth readings correspond to high water clarity. Conversely, low Secchi transparency is indicative of reduced water clarity that is often associated with the presence of suspended particles and algae blooms. Low Secchi transparency measurements are also indicative of limited light penetration and limited primary production. Water Temperature is a measure of the heat content. Since the solubility of DO decreases with increasing water temperature, high water temperatures limit the availability of DO for aquatic life. Also, water temperature regulates various biochemical reaction rates that influence water quality. Heat sources/sinks to a water body include various surface heat transfer mechanisms (that is, incident solar radiation, back radiation, evaporative cooling and heat conduction), thermal dischargers (for example power plants), tributary inflows and ground water discharge. As degraded water quality conditions may reduce the productivity and diversity of an aquatic ecosystem, ecological indicators are sometimes used to assess overall water quality and health. Such indicators focus on abundance and diversity of aquatic organisms such as algae, aquatic plants, benthic macroinvertebrates and fish. For example, elevated algal concentrations (blooms) are often indicative of excessive nutrient inputs (usually phosphorus and nitrogen) to a water body that result in a eutrophic state. Also, the occurrence of nuisance algal blooms and excessive aquatic plant growth may be related to environmental stress associated with deteriorated water quality conditions. Likewise, reduced benthic macroinvertebrate abundance (such as crayfish) and diversity may indicate degraded water quality conditions since these organisms are generally localised and display varying degrees of sensitivity to pollution.
The New Jersey Department of Environmental Protection monitors freshwater streams via the Ambient Biomonitoring Network {AMNET}(NJDEP, 2000). Each stream is rated as non-impaired, moderately impaired, or severely impaired. NJDEP samples over 800 stream sites statewide once every five years. There are a number of factors that impact streams that have been identified by this program. Environmental factors that may adversely affect stream biology, including both chemical and physical parameters, are:
Other NJDEP reports indicate that aquatic life impairments can generally be attributed to water quality, sediment quality, habitat alterations (for example, erosion, sedimentation), flow alterations (for example flashiness, low or high flows, drought), and natural population shifts. Habitat degradation can often result when waterways have been modified for flood control, drainage improvement, navigation, and urbanisation. Some human activities, land uses, and natural conditions that can contribute to degraded stream quality include:
The abundance and diversity of fish can also be used as an indicator of environmental health. As previously noted, adequate water column DO concentrations are needed to support life functions of various aquatic organisms. Hence, events such as fish kills are often indicative of depleted DO conditions (hypoxia). Moreover, the accumulation of toxins in fish tissue often reflects integrated effects of contamination in the environment. Accordingly, fish tissue analyses - such as for mercury - are commonly conducted to assess ecosystem health and impairment.
Surface Water Quality and Trends, Current StatusLong-Term TrendsA long-term trend analysis was conducted at the selected primary USGS/NJDEP monitoring sites using the entire available data records. Basically, a trend analysis is a statistical technique used to determine whether: (a) water quality is improving or degrading over time; and (b) compliance with criteria is increasing or decreasing over time. Thus, the trend analysis was conducted to provide a historical context for both the data and current river conditions. For the overall Passaic Watershed, the data indicate significant water quality improvement since the 1970’s. In particular, statistically significant and beneficial water quality trends were detected at most stations for DO, BOD5, TKN, ammonia nitrogen, total phosphorus and dissolved phosphorus. Meanwhile, significant increasing trends were often noted for nitrate nitrogen, TDS, chlorides and sodium. Many of these trends are undoubtedly due to an extensive program of treatment plant upgrading that occurred during the 1980s. General observations are as follows:
Impairments were documented for the following conventional water quality parameters: DO, fæcal coliforms, total phosphorus, pH and temperature. In addition, 3 stations were listed for trace metal violations.
Unfortunately, the Whippany River at Morristown (the monitored stream nearest to where I live) failed for these reasons:
Source: NJDEP website photo source: whippanyrailwaymuseum.org See also:
Isn't Chlorine Enough?
Any failure to clean up rivers and reservoirs that provide drinking water to thousands or even millions of New Jerseyans forces water utilities to chlorinate water that is contaminated with animal waste, sewage, fertiliser, algae, and sediment in order to provide water free of disease-causing microorganisms. Chlorine, when combined with the organic matter in this pollution, produces harmful chlorination byproducts (CBPs). The chlorination process results in the formation of varying amounts of potentially cancer-causing compounds called chloro-organic compounds (compounds containing chlorine and organic carbon chains). The most prevalent of these compounds are called trihalomethanes (THMs), of which chloroform is the most common. The discovery that chlorination results in the formation of chloro-organic substances poses a serious conflict for water resource policy makers. In spite of diligent efforts of water utilities to filter and clean water before they chlorinate, CBP levels remain high in water consumed by thousands of New Jersey residents each day. Small, currently unregulated systems that obtain water from rivers and reservoirs often provide their customers with water high in total THM levels. Industrial water pollution is not a major contributor to these types of CBPs in tap water. Instead, the main causes are sediments, nutrients, and pollution from agricultural and urban runoff, and, in some small systems, inappropriate overuse of chlorine. Until pollution from farms and urban runoff is limited so that water entering drinking water treatment plants is much cleaner than it is today, CBP levels will remain unacceptably high. The public has been led to believe that they must accept either water polluted with pathogens or water contaminated with high levels of chlorination byproducts. This is not true. Tap water can meet pathogen standards and be low in CBPs as well. (New methods of disinfection such as UV radiation and ozonation are currently being considered.) Cleaner source water is the critical step. Thus, no body of surface water in New Jersey is unimportant because each can yield a tiny snapshot of the area in which it is located. For the majority of systems with elevated CBP levels (often small rural types), cleaner source water requires action to reduce soil erosion, and nutrient and animal waste runoff. For large systems, runoff from suburban sprawl and upstream sewage discharges must also be controlled.
Morristown Wastewater Disposal
For more articles on New Jersey including facts, census data, complex highway interchanges, photos, transit plans, politicians, geology, canals, regions, governance, flora and
fauna click the "Up" button below to take you to the Table of Contents for this section |