Animals
 Animation
 Art of Playing Cards
 Drugs
Drugs Education
 Environment
 Flying
 History
 Humour
 Immigration
 Info/Tech
 Intellectual/Entertaining
 Lifestyles
 Men
Men Money/Politics/Law
 New Jersey
 Odds and Oddities
 Older & Under
 Photography
 Prisons
 Relationships
 Science
 Social/Cultural
 Terrorism
 Wellington
 Working
 Zero Return Investment
Population Pyramids
The Boom Moves AlongFor four-fifths of our history, our planet was populated by pond scum. - J W Schopf
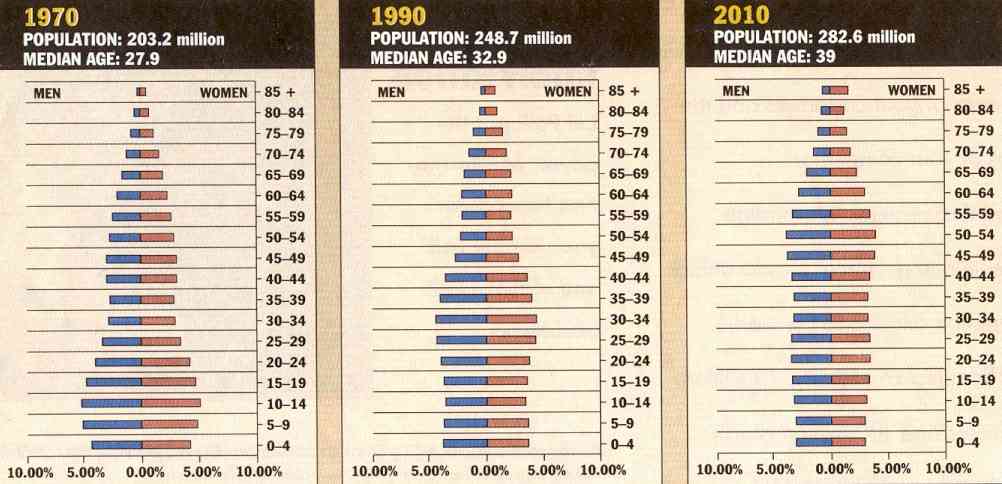
Percent of US population by age and sex, 1970, 1990 and projections for 2010 Population pyramids are the best way to see the ageing of the baby-boom generation. Over the generations, if migration was negligible, the bar graph would be a perfect pyramid. But in the real world, baby booms create bulges, while wars, plagues, and baby busts cause indentations. Usually the x-axis runs down the centre of an age pyramid, dividing the graph into men and women, white and nonwhite, or any other mutually exclusive pair that can help the analyst better understand the population. By looking at a pyramid, you can tell at a glance which populations dominate the community. It's easy to compare results across communities and to translate these findings into action. Age PyramidsThe 1990 age pyramid for the United States looks more like a barrel than a pyramid. That's because birth rates and mortality rates have both been low for many decades. The most noticeable feature of the American age pyramid is the bulge in the middle caused by the baby boom. Since 1946, this group has been working its way up the pyramid, like a pig passing through the digestive system of a python. Look at the pyramids for 1970, 1990, and a projection for 2010, and you can see how demographers got that impression. The US age pyramid for 1970 shows why America's youth orientation was so strong at that time. Half of the population was under age 28. But by 1990, the oldest baby boomers were in their mid-40s. And the US age pyramid clearly shows that they are not being surpassed by younger generations. In 1990, baby boomers represented one out of three Americans. Their concerns, from child care to health insurance and biological clocks, are America's most talked-about issues. By 2010, 49% of Americans will be aged 40 or older. The abundance of aging Americans will make the US pyramid look top heavy. As baby boomers age, the situation will become even more extreme. Businesses should be aware that local markets don't necessarily follow the US model. The age pyramids of youthful cities have a broad base. Baby-boom towns bulge in the middle. Retirement communities look like columns that lean to the woman's side. Some local figures already show the signs of advancing age, while others maintain a youthful appearance. Across the USAThe national picture is slowly changing, but much more radical examples can be seen at the local level. Local demographics are more noticeably affected by migration patterns within the US, by regional differences in birth rates, and by special residential facilities, like college dormitories and retirement communities. Donnelley Marketing Information Services identified the places with populations of 50,000 or more where the age distribution is most and least like the US as a whole. The results are displayed here.
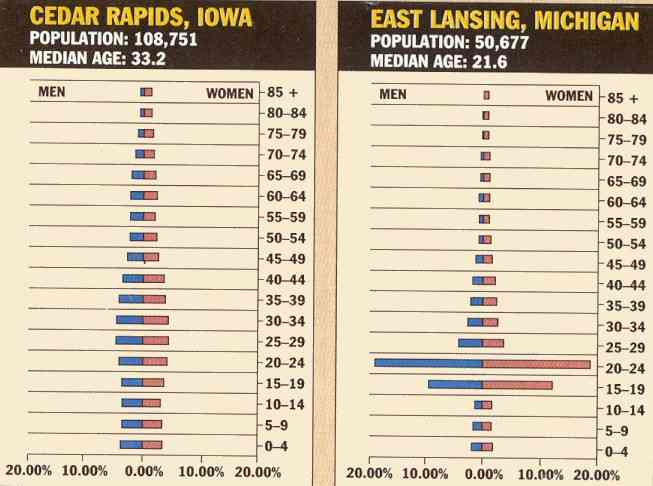
Percent of population by age and sex, 1990 Cedar Rapids, Iowa; Cheyenne, Wyoming; Tulsa, Oklahoma; and Billings, Montana, come closest to the US age distribution. All these cities would require a demographic shift of less than 2% to match the US pattern perfectly. But the cities that deviate the most from the US age distribution are East Lansing, Michigan; College Station, Texas; Bloomington, Indiana; and Provo, Utah. Moreover, they're all college towns. Almost 60% of the population in East Lansing, home to Michigan State University, are aged 15 to 24, compared with just 15% in Cedar Rapids. In order to match the US age pyramid, 44% of East Lansing's residents would have to change the dates on their birth certificates. Other Patterns
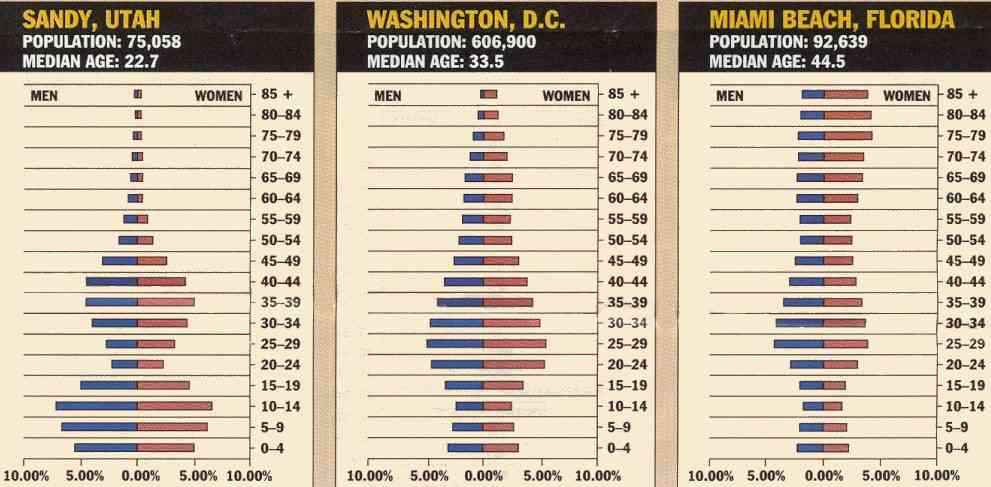
Percent of population by age and sex, 1990 Institutional populations are not the only factors that shape local age pyramids. Religious convictions account for the large youthful populations throughout Utah, for example. In Sandy, Utah, population 75,000, 38% of the population is under age 15, compared with a national average of 22%. But people in their parenting years - aged 30 to 49 - are just slightly higher in Sandy's population than in the nation as a whole, 32% versus 26%. That's because the average household in Sandy contains 3.85 people, compared with 2.63 nationally. Other age groups are underrepresented in Sandy's population. Adults aged 50 and older are 26% of the US population, for example, but they represent just 10% of Sandy's residents. And only 20% of Sandy's population is aged 15 to 29, compared with 23% of the US population. "Kids must go away to college, because there are no colleges in Sandy," says Brad Barber of the Utah State Data Centre. "And in a community highly dominated by Mormons, as Sandy is, 19-to-21-year-olds are required to go away on two-year missions." Job searches also lead to some out-migration in these age groups, he says. Labour force characteristics can also shape local age distributions. Baby boomers account for a larger share of the population in Washington, DC - 36%, versus 33% for the nation as a whole. Other boomer towns include service-oriented urban centres like Austin, Texas; Atlanta, Georgia; and Dallas, Texas. Migration can play an important role in shaping an area's age distribution. Retirement communities are especially apt to show different age patterns. Miami Beach, Florida, is dominated by older adults, for example. The share of its population that is under age 15 is only half of what it is for the nation as a whole. And baby boomers make up only 29% of residents, compared with 33% of all Americans. But the mature popuIation, those aged 50 and older, make up 44% of residents in Miami Beach, compared with only 26% for the nation as a whole. Not only is Miami Beach's age pyramid top heavy, but it also leans to one side. This slant results from the fact that women live longer than men. After age 80, there are nearly two women for every man in Miami Beach, and the age pyramid favours the women's side. Knowing that Miami Beach's median age is almost 45, or that East Lansing's median is about 22, can tell you something about consumer demand in those communities. However, median age is about 22 in both East Lansing and Sandy, and these two markets are very different. Most of East Lansing's residents are aged 15 to 24, for example, but these age groups are underrepresented in Sandy. With an age pyramid, businesses can get a more complete picture. Source: American Demographics August 1992 pages 48 - 52. Source figure 1, Bureau of the Census; source figures 2 and 3, 1990 census
It Takes a Village...If we could shrink the earth's population to a village of precisely 100 people, with all the existing human ratios remaining the same, it would look something like the following: There would be
When one considers our world from such a compressed perspective, the need for both acceptance, understanding and education becomes glaringly apparent. Source: Phillip M Harter, MD, FACEP Stanford University, School of Medicine
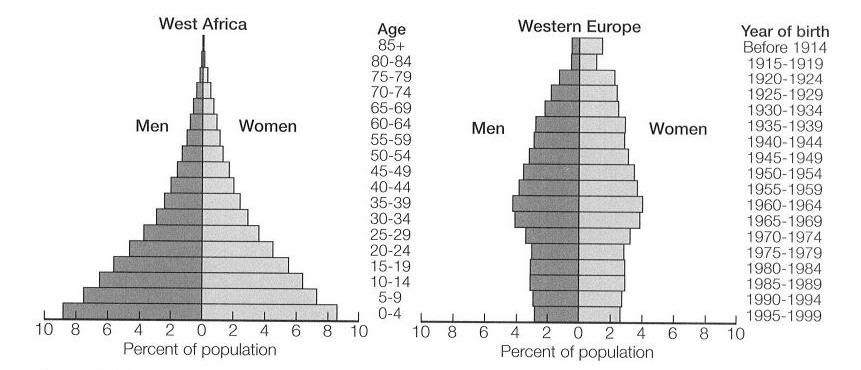
Age and Sex Profile for West Africa and Western Europe, 2000
Source: United Nations, World Population Prospects: the 2002 Revision (2003)
Population of the United States by Age and Sex
male female 1950-2050 (millions) Source: ac.wwu.edu from information supplied by International Data Base, US Census Bureau; modified using Canvas, GraphicConverter and GIFBuilder
For more articles relating to Money, Politics and Law including globalisation, tax avoidance, consumerism, credit cards, spending, contracts, trust, stocks, fraud, eugenics and more
click the "Up" button below to take you to the Table of Contents for this section. |